Extended usage
Here we present the various functionalities of Tracx with code snippets.
Create a new Tracx project
Start by generating first a new Tracx instance:
Tracker = TracX.Tracker();
Configure the new Tracx project
% [String] Name of the project / experiment
projectName = 'myProject';

% [String] File name identifier of raw images used
%                  to calculate the fingerprint (i.e. Brightfield).
fileIdentifierFingerprintImages = 'BF';

% [String] Well position identifier if multi well
%                  experiemnt was performed to use
fileIdentifierWellPositionFingerprint = [];

% [String] File identifier of fluorescent images to be used
%                  for asymmetrical lineage reconstruction.
fileIdentifierCellLineage = 'mKate';

% [Array, x, y, w, h] Image crop coordinates, in case only part
%                                         on an image was segmented.
imageCropCoordinateArray = [480 445 383 323];

% [Int] Max number of frames to track (if not full movie should be tracked
movieLength = 30;

% [String] Image directory to be used for the current project.
imageDir = 'C:\\myProject\\rawImages'

% [String] Directory containing the segmentation results for the current project.
segmentationResultDir = 'C:\\myProject\\CellXResults'

% [String] Cell division type. Either asymetrical or symetrical.
cellDivisisonType = 'asym';
Tracker.createNewTrackingProject(...
        projectName, imageDir, segmentationResultDir, ...
        fileIdentifierFingerprintImages, ...
        fileIdentifierWellPositionFingerprint, ...
        fileIdentifierCellLineage, ...
        imageCropCoordinateArray, movieLength, cellDivisisonType);
(Optional) Modify default parameters (if needed):
Tracker.configuration.ParameterConfiguration.setFingerprintHalfWindowSideLength(40);
Note: use TAB completion to get all parameter setters or consult the documentation i.e with
help(Tracker.configuration.ParameterConfiguration)
How to start…
… from CellX segmentation
If you used CellX to segment your microscopy images you can start right away by configuring a new tracking project
% Configure a new tracking project
projectName = 'MyExperiment'; % Project name
fileIdentifierFingerprintImages = 'BFdivide'; % Image idenfier for images (BF, PhC, FL);
fileIdentifierWellPositionFingerprint = []; % Well position identifier if multiwell experiment.
fileIdentifierCellLineage = {'mKate'}; % Image identifier for the Cell Lineage reconstruction (i.e bud neck marker).
imageCropCoordinateArray = []; % Empty if no crop has been applied in CellX, add CellX cropRegionBoundaries coordinates otherwise (from CellX_SCerevisiae_Parameter.xml).
movieLength = 60; % Number of timepoints to track
segmentationFilePath = 'D:\20200309\position250700\gt\CellXResultsNoDenoise'; % Path to segmentation results (CellX Style).
imageFilePath = 'D:\20200309\position250700\'; % Path to raw images.
cellDivisionType = 'asym'; % Cell division type. % Cell division type.

% Instantiate Tracker
Tracker = TracX.Tracker();
Tracker.createNewTrackingProject(projectName, imageFilePath, ...
                segmentationFilePath, fileIdentifierFingerprintImages, ...
                fileIdentifierWellPositionFingerprint, fileIdentifierCellLineage, ...
                imageCropCoordinateArray, movieLength, cellDivisionType);
… from labeled segmentation masks
If you have labeled segmentation mask from any segmentation algorithm you should first convert them to CellX style.
Note
A labeled segmentation mask is a matrix where each segmented object is represented with an integer number and where as non segmented areas (i.e. background) has the value 0.
A labeled segmentation mask can have the same size of the raw images or smaller. If it is smaller you need to know the top left coordinate of the are you segmented. Together with the size of the segmentation mask this will determine the imageCropCoordinateArray=[top_left_x, top_left_y, height, width]
If the labeled segmentation masks are saved in a multi-page single file tif destack it first (see Destack multi page tif).
% Convert labeled segmentation masks to CellX segmentation style
Tracker = TracX.Tracker();
imagePath = 'path\to\images';
segmentationPath = 'path\to\labeled_segmetation_masks';
segmentationFileNameRegex = 'labeled_mask_*';
imageFileNameRegex = 'BFdivide_*';
fluoTags = {'mKate', 'mKO'};
Tracker.prepareDataFromSegmentationMask(imagePath, ...
        segmentationPath, segmentationFileNameRegex, ...
        imageFileNameRegex, 'fluoTags', fluoTags)
clear Tracker
imagePath is the path to the raw images such as Bright field, Phase contrast or fluorescent channels. All timepoints for each well position in one folder.
segmentationPath is the path to your labeled segmentation masks; can be the same folder as the images.
segmentationFileNameRegex is the filename prefix of the labeled segmentation mask delimited by an underscore from the rest of the name. i.e. labeled_mask_position010100_time0001.tif
Note
add a ‘*’ at the end to match anything which will follow the given identifier.
imageFileNameRegex Filename prefix of the images to be segmented fluoTags Filename prefix of all the additional fluorescent channels to be quantified.
After the conversion is finished you can create a new tracking project as follows:
% Configure a new tracking project
projectName = 'MyExperiment';
fileIdentifierFingerprintImages = 'BFdivide';
fileIdentifierWellPositionFingerprint = [];
fileIdentifierCellLineage = {'mKate'};
imageCropCoordinateArray = [];
movieLength = 60;
segmentationFilePath = 'D:\20200309\position250700\gt\CellXResultsNoDenoise';
imageFilePath = 'D:\20200309\position250700\';
cellDivisionType = 'asym';

% Instantiate Tracker
Tracker = TracX.Tracker();
Tracker.createNewTrackingProject(projectName, imageFilePath, ...
                segmentationFilePath, fileIdentifierFingerprintImages, ...
                fileIdentifierWellPositionFingerprint, fileIdentifierCellLineage, ...
                imageCropCoordinateArray, movieLength, cellDivisionType);
Note
In the demo repo you find data as well ready to use matlab script demonstrating this different cases.
Parse image file names
If you acquired microscopy images which do not follow our image description standard of FileIdentifier_WellPosition_Time.FileType Tracx has a method to convert any filename into the required pattern.
imagesFilePath = 'Path\to\images';
% Parse the original file names and create a list of new names
Tracker.io.imageFileNameParser(imagesFilePath, 'imageFileType', 'JPG', 'timeRE', '(?<=time)\d*', 'positionRE', '(?<=Position\()\d*')
% Run the actula conversion
Tracker.io.convertImageFileNames(imagesFilePath)
imageFilePath Path to the original image files. Note the original image files will be kept but moved to a raw subfolder after conversion.
Key, value pairs for identifying parts from the images:
imageFileType: Image file type. Supported are ‘tif’, ‘TIF’, ‘TIFF’, ‘tiff’, ‘png’, ‘PNG’, ‘JPG’, ‘jpg’.
channelRE: Regular expression to identify the image channel.
positionRE: Regular expression to identify the well position.
planeRE :Regular expression to identify the image plane.
timeRE: Regular expression to identify the image frame number.
customChannel: Custom name for the channel.
customPosition: Custom position name.
customZIndex: Custom image plane index.
channelNameDict: Channel name dictionary.
Destack multi page tif
If your favourite segmentation algorithm saves the labeled segmentation masks as multi page tif or your images are saved in a single file stack you can use the following method to destack it prior to use the prepareDataFromSegmentationMask.
Tracker.io.destackTimepoints(inputFilePath, fileRegEx, numberOfTimepoints, numberOfPlanes, direction)
inputFilePath: Path to the file(s). Supported are ‘tif’, ‘TIF’, ‘TIFF’, ‘tiff’.
fileRegEx: Regular expression to identify the file.
numberOfTimepoints: Number of timepoints to be expected in the file.
numberOfPlanes : Number of image plane. Default is 1. For z stacks use the number of stacks here.
direction : 1 to scan trough the time points first; 0 to scan trough the (z) planes first.
Remove segmentation artefacts
By fluorescence
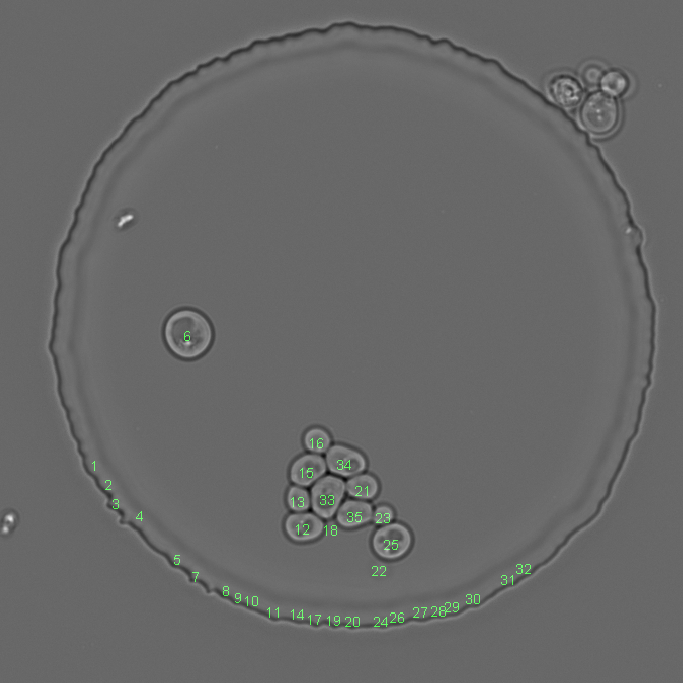
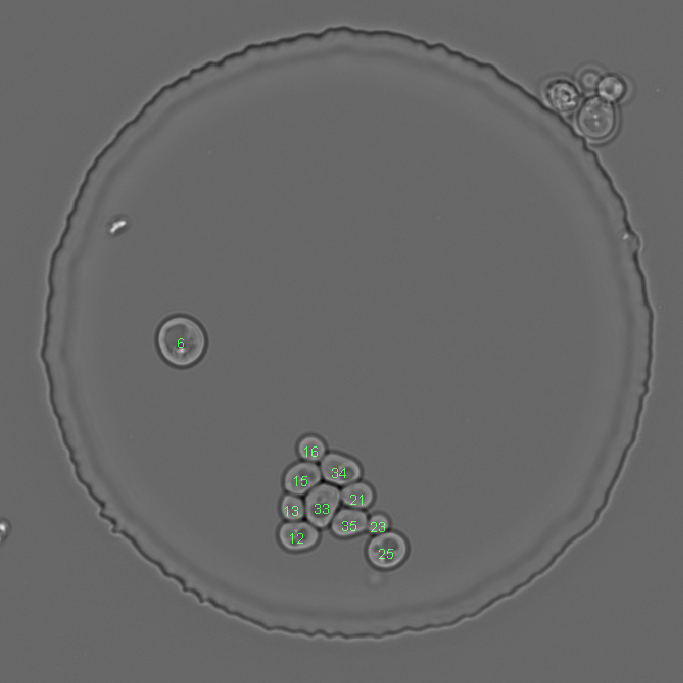
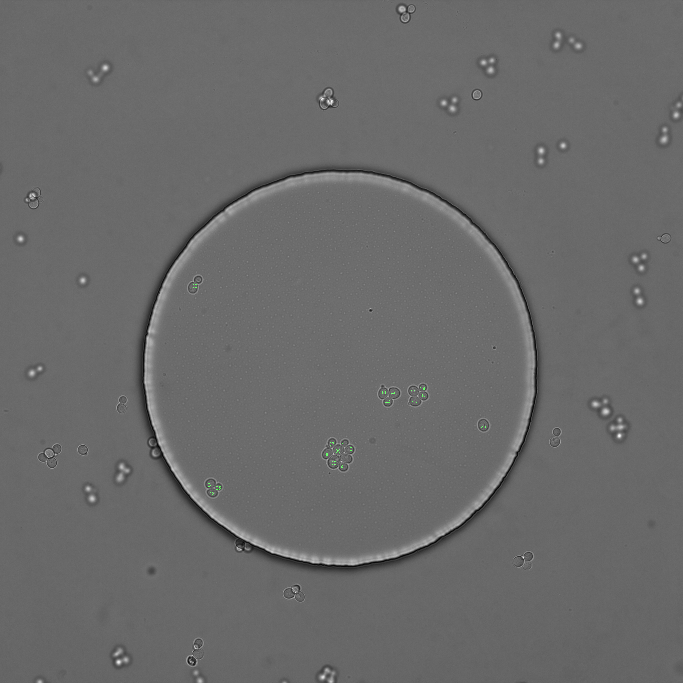
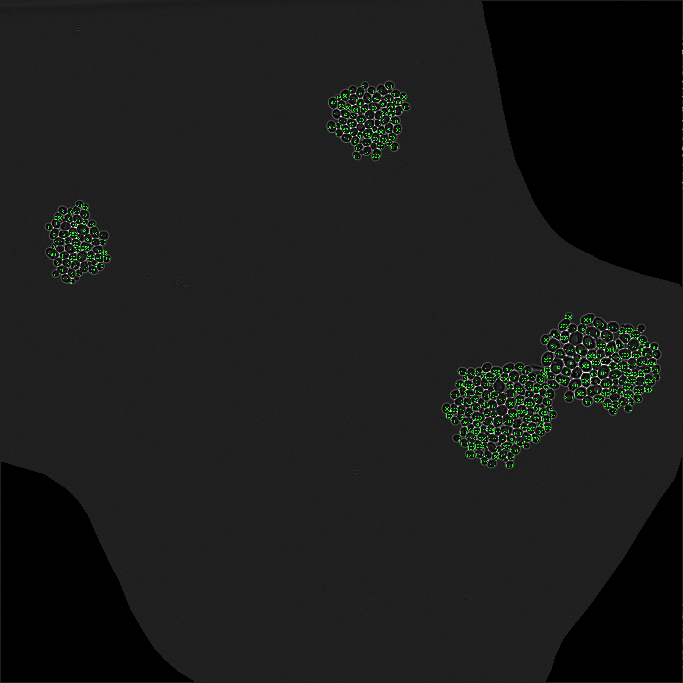
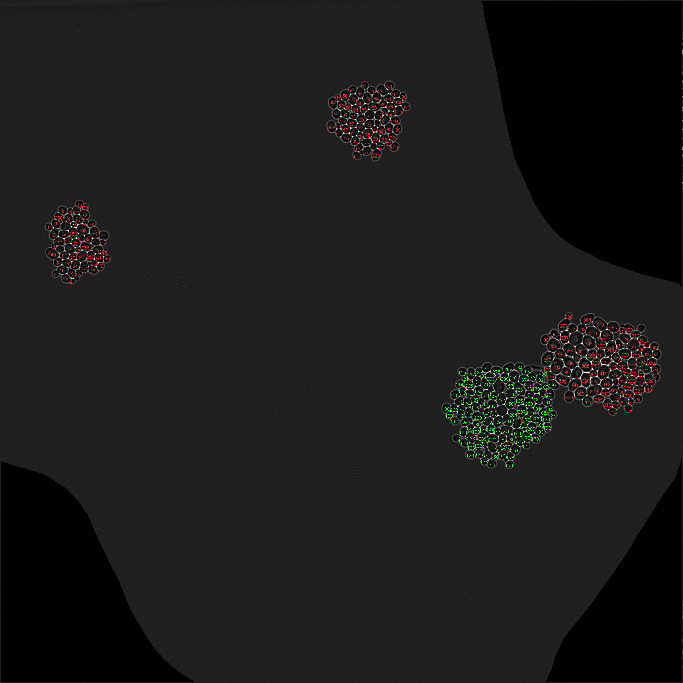
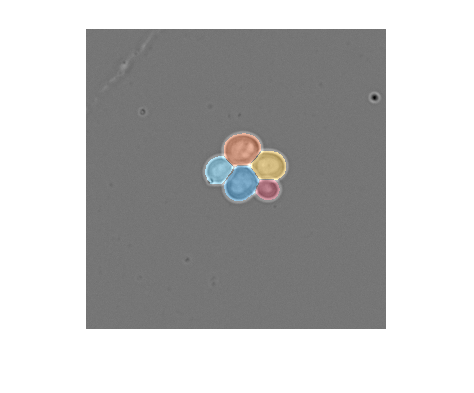
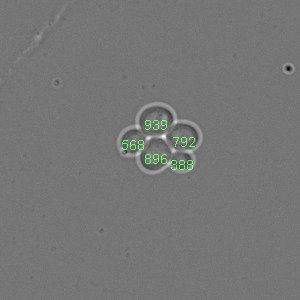
Depending on the segmentation algorithm used it can be that there are some false positive segmented artefacts which are not cells but i.e debris or dirt or just background pixels. Given that you have a fluorescent channel Tracx has a method which aims to remove these segmentation artefacts based on the assumption that false positive segmentations have no auto fluorescence or comparable to the cell surrounding.
Before removing anything you can test how well it works for a given channel and set of parameters with:
Tracker.testSegmentationArtefactRemoval(frame, fluoChannelId, stdFactor)
frame: image frame
fluoChannelId: Id number of the fluorescence channel as found in unique(Tracker.data.QuantificationData.fluo_id) and its corresponding name unique(Tracker.data.QuantificationData.fluo_name)
stdFactor: factor by which the standard deviation of the fluorescence background is multiplied to define a threshold below a cell intensity would be classified as artefact.
It will show a popup window with the segmentation id marked in red which would be removed and the once to keep in green.
To remove all artefacts in the full experiment type:
% Remove all found artefacts
Tracker.deleteSegArtefacts('channel', 1, 'stdFactor', 2)
Example with a lot of false positive segmentations and the result after removing them. Left image shows the initial situation. Middle image shows the test result. Right image shows the result after segmentation object removal

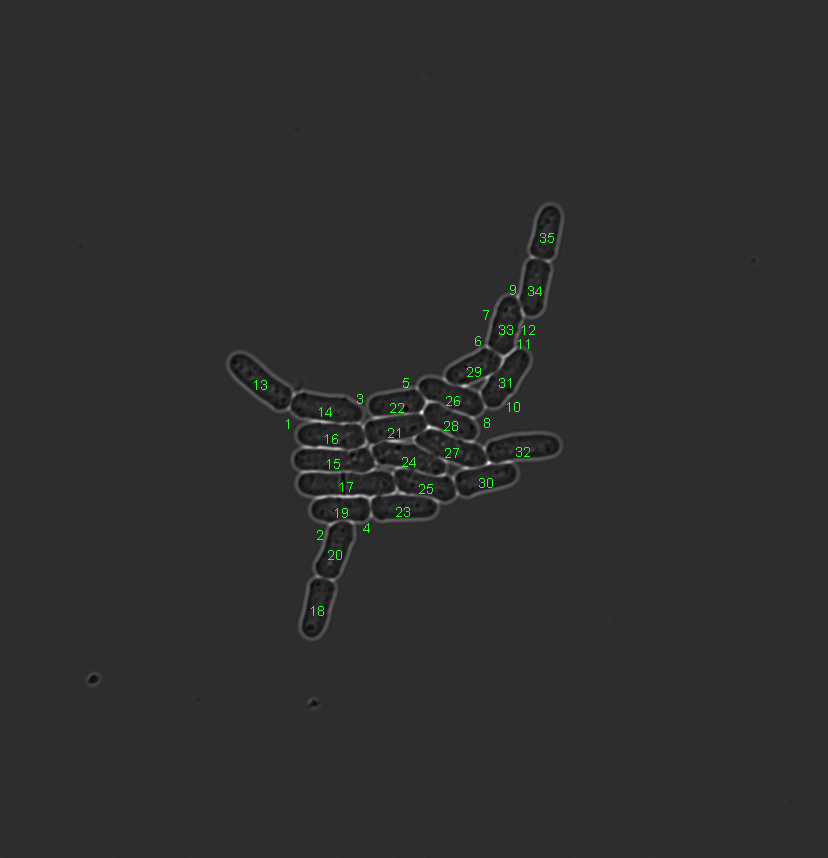
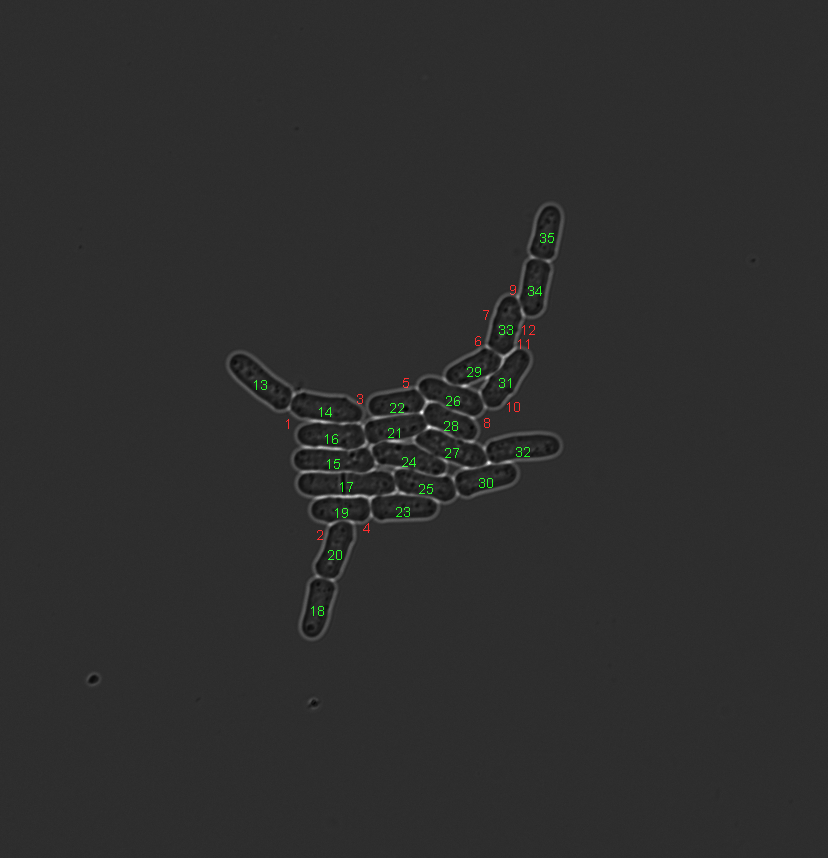
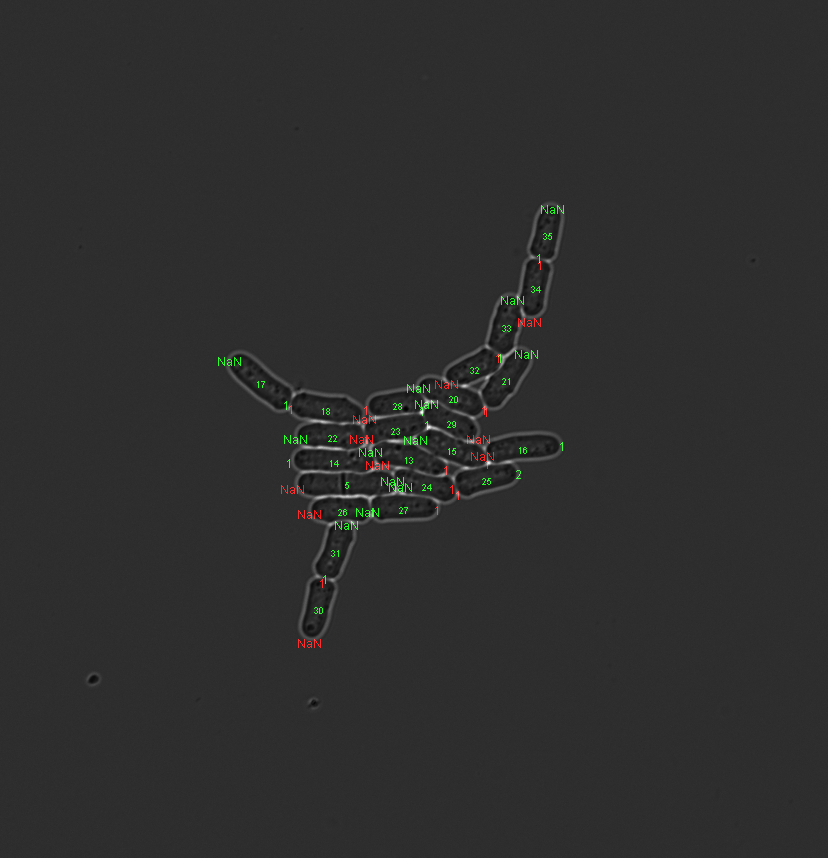
By feature
Depending on the segmentation algorithm used it can be that there are some false positive segmented artefacts which are not cells but i.e debris or dirt or just background pixels.
To test which data is removed on a frame an image will be displayed to show the data to be removed in red
Tracker.testFeatureDataRemoval(frameNumber, feature, threshold)
frameNumber Image frame to be displayed
feature: Name of the feature. i.e ‘cell_area’.
threshold Threshold value. i.e 1000 would remove all cells with an area below 1000.
% Remove all segmented objects below feature threshold
Tracker.deleteByFeature(feature, threshold)
feature: Name of the feature. i.e ‘cell_area’.
threshold Threshold value. i.e 1000 would remove all cells with an area below 1000.
Example that uses the area feature to remove small false positive segmentations. Left image shows the initial situation. Middle image shows the test result. Right image shows the result after segmentation object removal.

Constrain input data
By removing cells from image border
If you imaged the full field of view it is likely that your cells grow out of the image. This leads to missegmented cells on the image border where any quantification of part of these cells makes no sense. Therefore Tracx has a method implemented to remove all cells touching the border within a specified border offset distance.
To test which data is removed on a frame an image will be displayed to show the data to be removed in red
Tracker.testImageBorderDataRemoval(frameNumber, borderOffset)
frameNumber Image frame to be displayed
borderOffset: Offset from the image border in pixel. Cells within this offset would be removed on each frame.
If you want to finally remove such cells:
% Remove all segmented objects within the border offset.
Tracker.deleteSegObjAtBorder(borderOffset)
Example. Cells which will be excluded (red labels). Left image shows the initial situation. Middle image shows the test result. Right image shows the result after segmentation object removal:


By selecting a region of interest (ROI) to track
In some situation you want to analyze only a specific region in an image i.e a colony. Therefore Tracx has a method implemented to select a region of interest (ROI) in which cells will be tracked.
To specifiy and test a region of interest (ROI) on a frame an image will be displayed to show the data to be removed in red.
roi = Tracker.testROIDataRemoval(frameNumber)
frameNumber Image frame to be displayed
roi: Vector specifiing the vertices of the ROI.
% Remove all segmented objects outside the ROI
Tracker.deleteByROI(roi)
Example. Cells which will be excluded (red labels). Left image shows the initial situation. Middle image shows the test result. Right image shows the result after segmentation object removal:

Set parameters for tracking
Prior to running the Tracker it is advisable to check the default parameters and modify them depending on the cell type you want to track. To list the current parameters type (see section Description of the tracker parameters for parameter details):
     >> Tracker.configuration.ParameterConfiguration

General parameter:
                                        debugLevel: 1
                                            data3D: 0
                               cellThumbSideLength: 100
                                  maskOverlayAlpha: 0.4000

Tracking core parameter:
                         maxCellCenterDisplacement: 15
                               maxExpectedMovement: 75
                             averageCellSizeGrowth: 0.0300
                               maxCellSizeDecrease: 0.7500
                               maxCellSizeIncrease: 2.5000
                             maxTrackFrameSkipping: 2
                              maxMajorAxisRotation: 0
                         individualFunctionPenalty: 500
                        usedFunctionsForCostMatrix: [1 1 0 0]
                                  meanCellDiameter: 30
                     meanCellDiameterScalingFactor: 2.5000
                   fingerprintHalfWindowSideLength: 25
                           fingerprintResizeFactor: 32
               fingerprintMaxConsideredFrequencies: 8
                         neighbourhoodSearchRadius: 50
                               radiusVectorFilterX: 100
                               radiusVectorFilterY: 100
                               radiusVectorFilterZ: 100

Lineage reconstruction parameter:
               divisionMarkerEdgeSensitivityThresh: 0.3000
                           divisionMarkerDenoising: 25
               divisionMarkerConvexAreaUpperThresh: 100
               divisionMarkerConvexAreaLowerThresh: 5
                   divisionMarkerLineProfileLength: 100
           divisionMarkerLineProfilePeakLowerBound: 10
           divisionMarkerLineProfilePeakUpperBound: 90
            divisionMarkerMaxObjCenterDisplacement: 15
                 divisionMarkerMaxExpectedMovement: 75
                divisionMarkerAverageObjSizeGrowth: 0.0300
                  divisionMarkerMaxObjSizeDecrease: 0.7500
                  divisionMarkerMaxObjSizeIncrease: 2.5000
               divisionMarkerMaxTrackFrameSkipping: 2
                divisionMarkerMaxMajorAxisRotation: 0
           divisionMarkerIndividualFunctionPenalty: 500
          divisionMarkerUsedFunctionsForCostMatrix: [1 1 0 0]
                     divisionMarkerMeanObjDiameter: 30
        divisionMarkerMeanObjDiameterScalingFactor: 2.5000
     divisionMarkerFingerprintHalfWindowSideLength: 25
             divisionMarkerFingerprintResizeFactor: 32
 divisionMarkerFingerprintMaxConsideredFrequencies: 8
           divisionMarkerNeighbourhoodSearchRadius: 40
                 divisionMarkerRadiusVectorFilterX: 100
                 divisionMarkerRadiusVectorFilterY: 100
                 divisionMarkerRadiusVectorFilterZ: 100


     TracX version 1, release 1
To modify any of the parameters use set + the parameter name starting with a capital character. To modify i.e. the parameter maxCellCenterDisplacement use:
Tracker.configuration.ParameterConfiguration.setMaxCellCenterDisplacement(25)
Test tracking (dry run)
To check the tracking parameters and iteratively adjust them just type the frame range you want to test the parameters on.
from = 1; % Start tracking frame
to = 5; % End tracking frame
Tracker.testTrackingParameters([from, to])
This will open a viewer where each segmented cell is labeled with a track index showing the tracking result. If the cells are tracked correctly you can continue with the next step otherwise try to adjust the parameters more.
Start tracking
Tracker.runTracker()
Post tracking steps:
Tracker.saveTrackerProjectControlImages() % Save tracking result control images
Tracker.saveCurrentState() % Save current state of the tracker instance
Tracker.saveTrackingProject(filePath, fileName) % Export the project configuration
Tracker.data.joinTrackerDataAsTable()
Tracker.exportTrackingResults(Tracker.data.joinedTrackerDataTable, Tracker.configuration. ...
        ProjectConfiguration.segmentationResultDir, sprintf('%s_TrackingResults', ...
        Tracker.configuration.ProjectConfiguration.projectName)) % Save tracking results as csv table
At this point tracking is done and the results can exported as table and the tracker state could be saved.
Run lineage reconstruction:
Tracker.runLineageReconstruction('WriteControlImages', true)
Evaluate tracking results versus a ground truth:
Tracker.evaluation.evaluateDataPermutationConditions([1, 5, 10, 20, 50], 0:0.05:2, ...
        0.01, 2.5, 'fpDistLUTTS') % Based on fingerprintDistance
Tracker.evaluation.evaluateDataPermutationConditions([1, 5, 10, 20, 50], 0:0.01:1, ...
        0.01, 2.5, 'pLowerFPLUTTS') % probability based on neighbourhood
Reconstruct cell genealogy
… for symmetrically dividing cell types
This requires no further input and can be run directly after tracking.
% Run lineage reconstruction
Tracker.runLineageReconstruction('symmetricalDivision', true, 'writeControlImages', false);
symmetricalDivision: true for symmetrical division
writeControlImages: If true control images are saved, this includes a pole age control image where each cell pole is labeled with its respective age.
… for asymmetrically dividing cell types
This requires an additional input (fluorescence image) using a bud neck marker such as Myo1. The marker should connect each mother with its daughter until division. This marker will be tracked and used to assign the daughters to their mothers.
Prior running the lineage reconstruction you should test the parameters for the marker segmentation. They differ slightly for each experimental setup and depend on the signal to noise ratio (SNR) of the fluorophore used for the marker.
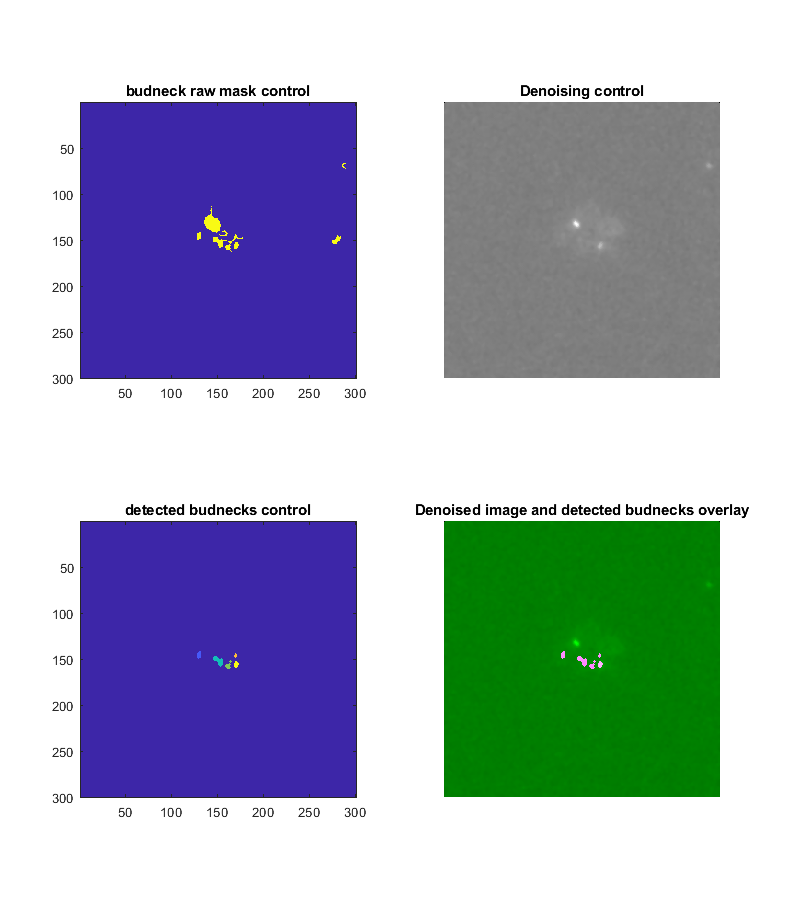
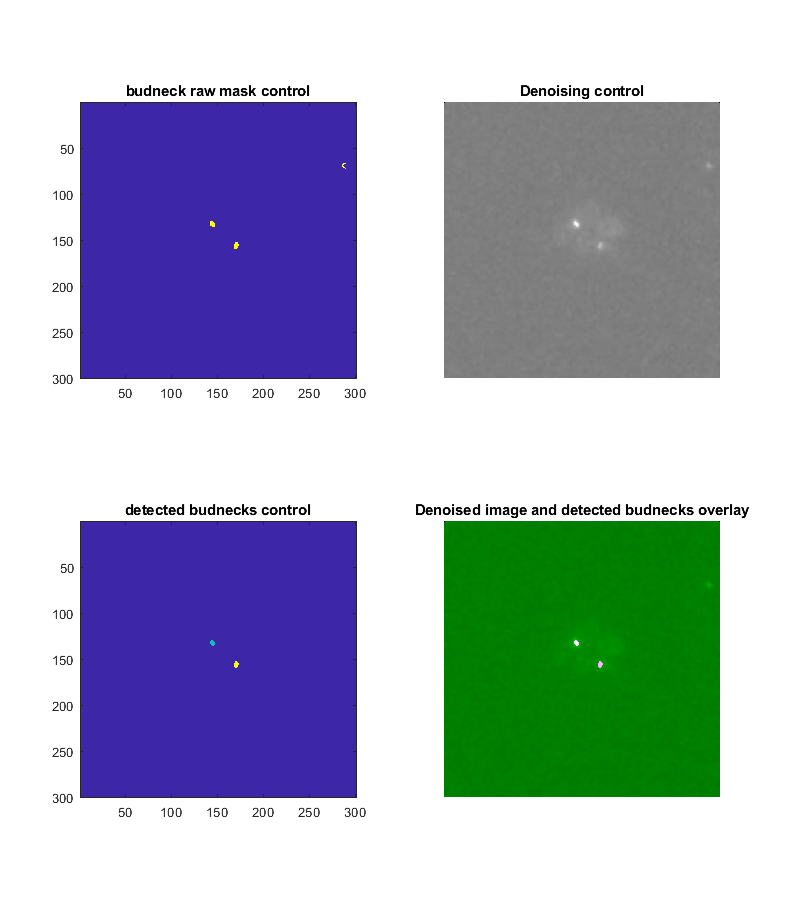
The test method displays four control images of a specified frame depicting the results of the marker segmentation. Type:
Tracker.testBudNeckSegmentation(frameNumber, key, value)
divisionMarkerDenoising: Each image is first being denoised using the ROF algorithm. Default is 25 which works well in almost all cases.
divisionMarkerEdgeSensitivityThresh: Sensitivity threshold of how many objects should be detected. The lower the more.
divisionMarkerConvexAreaLowerThresh: Lower size bound to filter the detected objects.
divisionMarkerConvexAreaUpperThresh: Upper size bound to filter the detected objects.
contrastLimits, Contrast limits as array given by lower and upper bound in the range [0, 1].
The resulting images are the denoised image, a mask with all detected objects, a mask with the filtered objects, an image where the filtered object masks are overlaid on the denoised image. The last one gives a good impression if the bud necks were correctly detected. False positives should be kept minimal but will be filtered out later.
As for the tracking parameters there is a method for _testing_ the parameters for the marker tracking:
from = 1;
to = 5;
Tracker.testMarkerTrackingParameters([from, to])
This will track the bud neck marker and display a series of control images to inspect the result. The more accurate this results are (good set of parameters) the better the cell cycle phase determination after lineage reconstruction will be.
Run the lineage reconstruction
% Run lineage reconstruction
Tracker.runLineageReconstruction('symmetricalDivision', false, 'writeControlImages', false);
symmetricalDivision: false for asymmetrical division
writeControlImages: If true various control images are saved, this includes a budneck marker cell segmentation mask overlay, marker tracking control images, G1 phase extraction for each cell track control

Note
The budneck marker cell segmentation mask control images help to quickly correct potential non assigned buds to mother manually, since one can read off the track index of mother and bud and check if a budneck signal is present.
The budneck marker tracking control help to evaluate if the divisionMarker* tracking parameters from Tracker.configuration.ParameterConfiguration are set properly. If a budneck for a given mother bud pair is not tracked well change and test these parameters further.
The G1 phase determination control image gives an idea for each track how well the G1 phase has been determined.
Save cell cycle data
To save cell cycle information such as generation, age, and G1 and S/G2/M duration type:
Tracker.saveTrackerCellCycleResultsAsTable('resultFilePath', '\path\to\folder\', 'resultFileName', 'CellCycleSummary')
resultFilePath: Path where to save the results
resultFileName: Name of the file
Optional key value pairs:
fileType: File type; Default is _txt_
dataDelimiter: Data delimiter; Default is _tab_
The table can be accessed with:
Tracker.lineage.cellCyclePhaseTable

ans =

  2×13 table
```
track    parent    daughter    tree    generation    age    pole1_age    pole2_age    g1_st    g1_e    g1_dur    g2_st    g2_e    g2_dur    div    seg_st_track    seg_st_daughter
_____    ______    ________    ____    __________    ___    _________    _________    _____    ____    ______    _____    ____    ______    ___    ____________    _______________

  1        0           7         1          0         1        NaN          NaN         1        7        7         8      18       11       18          1                12
  2        0           6         2          0         1        NaN          NaN         1        4        4         5      29       25       29          1                10
Description of the cell cycle phase results:
track: Track index of the cells.
parent: Parent track index of the cell track.
daugther: Daughter track index of the cell track.
tree: Identifier for a tree if several root cells are present at experiment start.
generation: The generation of the cell track (asym division).
age: The age of the cell track (asym division).
pole1 age: The age of the cell track (sym division).
pole2 age: The age of the cell track (sym division).
g1_st: Start frame of the cell track G1 phase.
g1_e: End frame of the cell track G1 phase.
g1_dur: Duration of the cell track G1 phase (unit frames).
g2_st: Start frame of the cell track G2 phase.
g2_e: End frame of the cell track G2 phase.
g2_dur: Duration of the cell track G2 phase (unit frames).
div: Division frame of the cell track. Time of cytokinesis.
seg_st_track: First time point where the cell track got segmented.
seg_st_daughter: First time point where the daughter cell of track got segmented.
Note
The deterimination of the G1 and G2 phases relies on fluorescent markers. For S.cerevisiae we use the nuclear relocalistation of the protein Whi5 to the nucleus as well as Myo1 a so called budneck marker to determine G2 phase. Other markers can be used such as H2B, cdc 11 or 12.
Generally the markers (with good signal to noise ratio) is more sensitive to estimate the start of G2 than the apperance of the bud and its segmentation. However both informations g2_st (marker) as well as seg_st_daughter are saved for further analysis.
Manual lineage assignment correction
For wrong linkages in a lineage where a daughter got assigned to a wrong mother or a daughter was not assigned to a mother this can be batch fixed manually.
Tracker.correctMDMisassignment(trackIndexDaughter, newMotherTrackIndex)
trackIndexDaughter: An array with the daughter track indices to correct
newMotherTrackIndex: An array of equal size with mother track indices representing the correct assignments.
Manual track assignment correction
For wrong track assignments where a wrong cell got to a track this can be batch fixed manually.
Tracker.correctTrackMisassignment(frameArray, oldTrackIndexArray, newTrackIndexArray)
frameArray: An array with the frame numbers for which track assignments should be corrected for.
oldTrackIndexArray: An array of equal size with current track indices.
newTrackIndexArray: An array of equal size newly corrected track indices representing the correct assignments.
Save tracking results
To save tracking results as table type:
Tracker.saveTrackerResultsAsTable()
The results will be saved in the segmetationResultsDir under the filename ProjectName_TrackingResults_Timestamp. If you want to change the type of the file and the data delimiter just pass it as extra argument. Default is text and tab delimited.
Optional key, value:
fileType: File type; Default is _txt_; Valid types are: ‘txt’, ‘csv’, ‘mat’
dataDelimiter: Data delimiter; Default is _tab_; Valid delimiter are: ‘,’, ‘comma’, ‘ ‘, ‘space’, ‘t’, ‘tab’, ‘;’, ‘semi’, ‘|’, ‘bar’
Save control images
Tracx allows for saving extensive control images which help you evaluate your results further. This will save the relabeled segmentation mask files with the track labels, track control mask images where each segmentation is colored by track index as well as track control images where the raw images will be labeled by the track numbers.
Tracker.saveTrackerProjectControlImages('isParallel', true, 'maxWorkers' 4)
isParallel: (optional) Allows to save the frames in parallel if set to true; requires the ParallelComputingToolbox.
maxWorkers: (optional) Defines how many workers will be used to save the control images in paralel. Default is 4.

Save a Tracx project
Export the project configuration to a xml file.
filePath = pwd;
fileName = 'MyProject.xml';
Tracker.saveTrackingProject(filePath, fileName)
Load a Tracx project
Load a project configuration from an Tracx xml file.
filePath = pwd;
fileName = 'MyProject.xml';
Tracker.loadTrackingProject(filePath, fileName)
Save Tracx state
To resume work at a later time you can save the current work at any time by calling:
Tracker.saveCurrentTrackerState()
>> 02-Aug-2021 09:20:39:  SAVE: Tracker state
>> 02-Aug-2021 09:20:39:  SAVE: C:\\myProject\\202182092039_TracX_State_Demo_Project.mat
>> 02-Aug-2021 09:20:39:  SAVE: Tracker state done!
Tracker.saveCurrentTrackerState('directory', 'path\to\your\project', 'projectName', 'configuration_file_name')
This will save the state with the configuration_file_name and a timestamp as mat file.
Load Tracx state
To load a previous Tracx state and resume work on a project just double click on the file or type:
load('202182092039_TracX_State_Demo_Project.mat')
Plotting
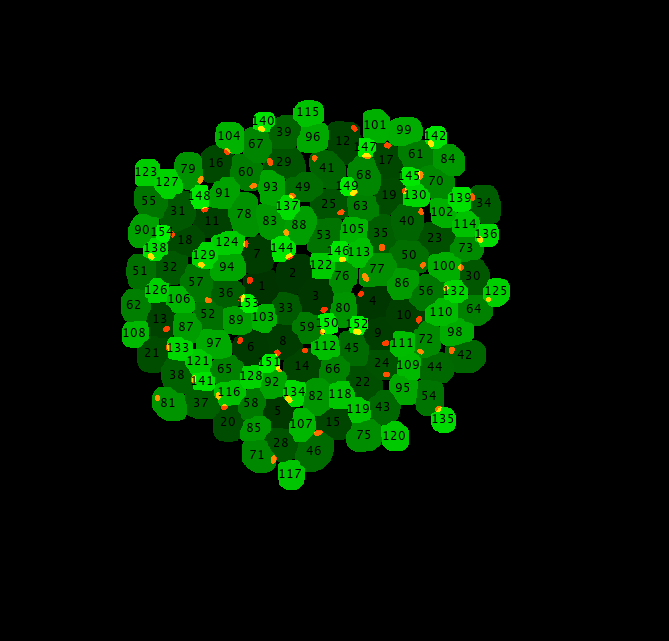
Plot any segmentation property
Plot any segmentation property such as ‘cell_area’ at the location of each cell
Tracker.imageVisualization.plotAnnotatedControlImageFrame(frameNumber, 'track_index')
frameNumber: Image frame to be displayed
property: Any of these: ‘uuid’, ‘cell_frame’, ‘cell_index’, ‘cell_center_x’, ‘cell_center_y’, ‘cell_majoraxis’, ‘cell_minoraxis’, ‘cell_orientation’, ‘cell_area’, ‘cell_volume’, ‘cell_perimeter’, ‘cell_eccentricity’, ‘cell_fractionOfGoodMembranePixels’, ‘cell_mem_area’, ‘cell_mem_volume’, ‘cell_nuc_radius’, ‘cell_nuc_area’, ‘cell_close_neighbour’, ‘cell_dif_x’, ‘cell_dif_y’, ‘cell_filtered_dif_x’, ‘cell_filtered_dif_y’, ‘cell_pole1_x’, ‘cell_pole1_y’, ‘cell_pole2_x’, ‘cell_pole2_y’, ‘cell_pole1_age’, ‘cell_pole2_age’, ‘track_index’, ‘track_index_qc’, ‘track_fingerprint_real’, ‘track_fingerprint_real_distance’, ‘track_age’, ‘track_parent’, ‘track_parent_frame’, ‘track_generation’, ‘track_lineage’, ‘track_cell_cycle_phase’, ‘track_total_assignment_cost’, ‘track_position_assignment_cost’, ‘track_area_assignment_cost’, ‘track_rotation_assignment_cost’, ‘track_frame_skipping_cost’, ‘track_start_frame’, ‘track_end_frame’, ‘track_index_corrected’, ‘track_contained_in_track’, ‘track_has_bud’
fontSize: Fontsize for the labels; Default is 14
isSegmentationCrop: If only a small area of the image has been segmented the full image can be cropped to this size to focus on the relevant part. It takes an array with the form [top_left_x, top_left_y, height, width].
% I.e for frame 15 we want to annotate the cell area. Skipping the property
% argument takes the track_index by default to inspect how well the
% tracking went.
Tracker.imageVisualization.plotAnnotatedControlImageFrame(15, 'cell_area')
Plot fingerprint control
To visualize which pixels will be used to compute the cell fingerprint this method can be used. It draws a rectangle around each cell center for the given fingerprintHalfWindowSideLength.
Tracker.imageVisualization.plotFingerprintControlImageFrame(fontSize, fingerprintHalfWindowSideLength, frameNumber)
fontSize: Font size for the cell labels
fingerprintHalfWindowSideLength: Half length of the fingerprint window
frameNumber Image frame to be displayed

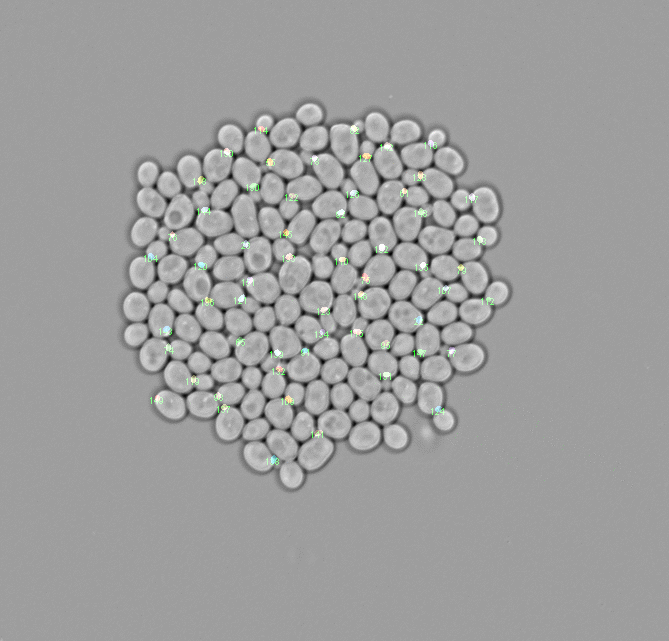
Plot tracking control
To visualize tracking results for a given frame:
Tracker.imageVisualization.plotTrackControlImageFrame(frameNumber)
frameNumber Image frame to be displayed
Plot pole age control
To visualize pole age (symetrical lineage reconstruction) for a given frame:
Tracker.imageVisualization.plotPoleAgeControlImageFrame(fontSize, frameNumber)
fontSize Fontsize of labels. frameNumber Image frame to be displayed.
Plot lineage tree
To plot the lineage tree for a given tree root type:
Note
Requires to reconstruct the lineage first.
Tracker.imageVisualization.plotLineageTree('symmetrical', rootTrack, 'plotToFigure', false)
divisionType: Division type, either ‘asymmetrical’ or ‘symmetrical’
rootTrack: Root track index of the lineage to be visualized
plotToFigure: If false it will print the lineage directly to the MATLAB console otherwise it will return a cell array with the figure handle and display the figure.

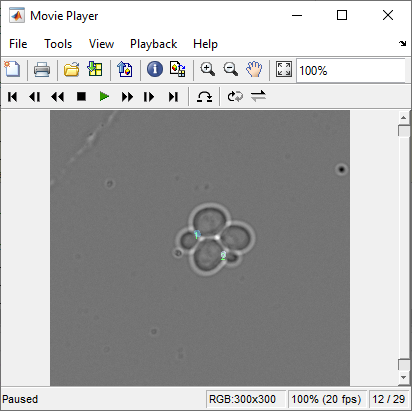
Plot a lineage movie
To save a lineage as a movie for presentation purpose type:
Note
Requires to reconstruct the lineage first.
Tracker.imageProcessing.generateLineageMovie(rootTrack, imageFrequency, 'path\to\file\MovieName')
rootTrack: Lineage root to be displayed
imageFrequency: Imaging interval / 60 min.
filePathName: Full path and name under which the movie should be saved
Optional key, value pairs:
videoQuality: Quality of the video. Default is100
videoFrameRate: Video frame rate; Default is 5;
videoProfile: Video profile; Default is ‘MPEG-4’; Valid profiles are: ‘Archival’, ‘Motion JPEG AVI’, ‘Motion JPEG 2000’, ‘MPEG-4’, ‘Uncompressed AVI’, ‘Indexed AVI’, ‘Grayscale AVI’
Access data
To work with tracking and segmentation results Tracx has some handy function to access any segmentation property.
Get data for a given data property for the full experiment (i.e track index).
Tracker.data.getFieldArray(property, channel_id)
property: Segmentation or Quantification data property (i.e. track_index)
channel_id (optional): If multiple fluorescence channels are present select the id for which to get the data. Default is 1.
Get data for a given data property for a given frame (i.e track index for frame 1).
Tracker.data.getFieldArrayForFrame(property, frameNumber, channel_id)
property: Segmentation or Quantification data property (i.e. track_index)
frameNumber: Frame number (i.e. 1).
channel_id (optional): If multiple fluorescence channels are present select the id for which to get the data. Default is 1.
Get data for a given data property for a list of tracks on a given frame (i.e cell area for track 1 and 2 on frame 10).
Tracker.data.getFieldArrayForTrackIndexForFrame(property, frameNumber, trackIndexArray, channel_id)
property: Segmentation or Quantification data property (i.e. cell_area)
frameNumber: Frame number (i.e. 1).
trackIndexArray: Array of track indices (i.e. [1,2,3]). Note data will be sorted in the order the track indices are given.
channel_id (optional): If multiple fluorescence channels are present select the id for which to get the data. Default is 1.
Get data for a given data property for a track for the full experiment (i.e cell area for track 1).
Tracker.data.getFieldArrayForTrackIndex(property, track_index, channel_id)
property: Segmentation or Quantification data property (i.e. cell_area)
track_index: Track index of cell.
channel_id (optional): If multiple fluorescence channels are present select the id for which to get the data. Default is 1.
Get data for a subset of a given data property on a given frame (i.e cell volume on frame 1 for the subset logical([1, 0, 0])). Requires to know how many cells exist on a given frame (i.e Tracker.data.getNumberOfRowsFromFrame(1))
Tracker.data.getFieldArrayForSubsetOnFrame('cell_volume', frameNumber, subset, channel_id)
property: Segmentation or Quantification data property (i.e. cell_volume)
frameNumber: Frame number (i.e. 1).
subset: Logical array to subset the data (i.e. logical([1, 0, 0]))
channel_id (optional): If multiple fluorescence channels are present select the id for which to get the data. Default is 1.
Get data for a property matching a condition for another property. I.e We want to find all fluo_cell_total data for track_index == 1 for the channel 2.
Tracker.data.getConditionalFieldArray(property, propertyCon, condition, channel_id )
property: Segmentation or Quantification data property (i.e. fluo_cell_total)
propertyCon: Segmentation or Quantification data property to match (‘i.e. track_index)
condition: The actual condition (i.e 1 to find all fluo_cell_total data for track_index == 1)
channel_id (optional): If multiple fluorescence channels are present select the id for which to get the data. Default is 1.
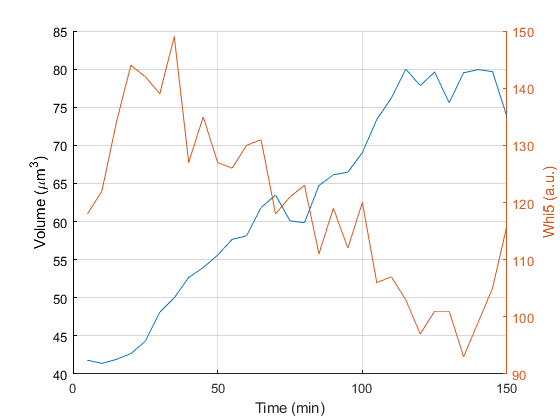
Example to plot the cell volume for a given track over time:
% Get data
time = Tracker.data.getFieldArrayForTrackIndex('cell_frame', 3);
vol = Tracker.data.getFieldArrayForTrackIndex('cell_volume', 3);
sig = Tracker.data.getFieldArrayForTrackIndex('fluo_nuc_q75', 3, 1);
bkg = Tracker.data.getFieldArrayForTrackIndex('fluo_background_mean', 3, 1);
% Convert units
time = time .* 5; % for 5 min time interval
vol = vol .* (6.5/40)^3; % convert voxel to micron^3 with 6.5 micron pixel size, 40X magnification.

% Plot data
figure; plot(time, vol);
ylabel('Volume (\mum^3)')
hold on; yyaxis right; plot(time, sig-bkg);
xlabel('Time (min)')
ylabel('Whi5 (a.u.)')
grid on; box off;
set(gcf,'color','w');
Description of the tracker parameters
Parameter name |
Unit |
Default value |
Parameter description |
|---|---|---|---|
maxCellCenterDisplacement |
px |
15 |
Max. displacement of segmented objects in pixel allowed in any direction for consecutive image frames (depends on pixel size and magnification). |
maxExpectedMovement |
px |
75 |
Max expected (linear) movement of one or multiple segmented objects as i.e colony jump in pixel (depends on pixel size and magnification). Default to 2.5 * the average cell diameter. Should be adjusted to largest observed movement. |
averageCellSizeGrowth |
% |
0.03 |
Average fractional growth of an identical segmented object between two subsequent image frames (i.e. cell area or nuclear area). |
maxCellSizeDecrease |
% |
0.75 |
Max. fractional segmented object size decrease for subsequent image frames. |
maxCellSizeIncrease |
% |
2.5 |
Max. fractional segmented object size increase for subsequent image frames. |
maxMajorAxisRotation |
deg |
0 |
Max. tolerated major axis rotation (not needed for round objects). |
individualFunctionPenalty |
500 |
Individual penalty maximum for each cost function (i.e. for position area rotation). |
|
maxTrackFrameSkipping |
frame |
2 |
Max. number of frames where a segmented object is allowed to be missing from a track. |
usedFunctionsForCostMatrix |
[1,1,0,0] |
Array specifying which cost functions to consider to build final cost matrix. |
|
meanCellDiameter |
px |
30 |
Mean cell diameter of all segmented objects of all image frames of the whole experiment. |
meanCellDiameterScalingFactor |
2.5 |
Mean cell diameter scaling factor to scale the max allowed linear motion of cells in respect to the mean cell diameter. |
|
fingerprintHalfWindowSideLength |
px |
25 |
Half window side length of a square around the centroid coordinates of a segmented object to be used to for fingerprint computation. |
fingerprintResizeFactor |
32 |
Resize factor applied to image matrix before fingerprint calculation. |
|
fingerprintMaxConsideredFrequencies |
8 |
Number of DCT frequencies to include for fingerprint computation. |
|
fingerprintDistThreshold |
0 |
Fraction fingerprint threshold below which two fingerprints are considered to be identical. |
|
neighbourhoodSearchRadius |
px |
40 |
Radius around a centroid coordinates of a segmented object used to detect the neighboring cells. |
radiusVectorFilterX |
px |
100 |
Radius equals to the first standard deviation of a 2D Gaussian distribution around a cell center in X. The radius is used calculate the neighborhood weighted cell center displacement in X. |
radiusVectorFilterY |
px |
100 |
Radius equals to the first standard deviation of a 2D Gaussian distribution around a cell center in Y. The radius is used calculate the neighborhood weighted cell center displacement in Y. |
radiusVectorFilterZ |
px |
100 |
Radius equals to the first standard deviation of a 2D Gaussian distribution around a cell center in Z. The radius is used calculate the neighborhood weighted cell center displacement in Z. |
divisionMarkerEdgeSensitivityThresh |
0.3 |
Edge sensitivity threshold for division marker segmentation. |
|
divisionMarkerConvexAreaUpperThresh |
100 |
Convex area upper threshold used for division marker segmentation selection to exclude segmentation artifacts. |
|
divisionMarkerConvexAreaLowerThresh |
5 |
Convex area lower threshold used for division marker segmentation selection to exclude segmentation artifacts. |
|
divisionMarkerMaxObjCenterDisplacement |
px |
25 |
Max. displacement of segmented objects in pixel allowed in any direction for consecutive image frames (depends on pixel size and magnification). |
divisionMarkerMaxExpectedMovement |
px |
15 |
Max expected (linear) movement of one or multiple segmented objects as i.e colony jump in pixel (depends on pixel size and magnification). Default to 2.5 * the average cell diameter. Should be adjusted to largest observed movement. |
divisionMarkerAverageObjSizeGrowth |
% |
0.03 |
Average fractional growth of an identical segmented object between two subsequent image frames (i.e. cell area or nuclear area). |
divisionMarkerMaxObjSizeDecrease |
% |
0.75 |
Penalty for maximum fractional segmented object size decrease for subsequent image frames. |
divisionMarkerMaxObjSizeIncrease |
% |
2.5 |
Penalty for maximum fractional segmented object size increase for subsequent image frames. |
divisionMarkerMaxMajorAxisRotation |
deg |
0 |
Max. tolerated major axis rotation (not needed for round objects). |
divisionMarkerIndividualFunctionPenalty |
500 |
Individual penalty maximum for each cost function (i.e. for position area rotation). |
|
divisionMarkerMaxTrackFrameSkipping |
frame |
2 |
Max. number of frames where a segmented object is allowed to be missing from a track. |
divisionMarkerUsedFunctionsForCostMatrix |
[1,1,0,1] |
Array specifying which cost functions to consider to build final cost matrix. |
|
divisionMarkerMeanCellDiameter |
px |
30 |
Mean cell diameter of all segmented objects of all image frames of the whole experiment. |
divisionMarkerMeanCellDiameterScalingFactor |
2.5 |
Mean cell diameter scaling factor to scale the max allowed linear motion of cells in respect to the mean cell diameter. |
|
divisionMarkerFingerprintHalfWindowSideLength |
px |
25 |
Half window side length of a square around the centroid coordinates of a segmented object to be used to for fingerprint computation. |
divisionMarkerFingerprintResizeFactor |
32 |
Resize factor applied to image matrix before fingerprint calculation. |
|
divisionMarkerFingerprintMaxConsideredFrequencies |
8 |
Number of DCT frequencies to include for fingerprint computation. |
|
divisionMarkerFingerprintDistThreshold |
0 |
Fraction fingerprint threshold below which two fingerprints are considered to be identical. |
|
divisionMarkerNeighbourhoodSearchRadius |
px |
40 |
Radius around a centroid coordinates of a segmented object used to detect the neighbouring cells. |
divisionMarkerRadiusVectorFilterX |
px |
100 |
Radius equals to the first standard deviation of a 2D Gaussian distribution around a cell center in X. The radius is used calculate the neighborhood weighted cell center displacement in X. |
divisionMarkerRadiusVectorFilterY |
px |
100 |
Radius equals to the first standard deviation of a 2D Gaussian distribution around a cell center in Y. The radius is used calculate the neighborhood weighted cell center displacement in Y. |
divisionMarkerRadiusVectorFilterZ |
px |
100 |
Radius equals to the first standard deviation of a 2D Gaussian distribution around a cell center in Z. The radius is used calculate the neighborhood weighted cell center displacement in Z. |
divisionMarkerLineProfileLength |
px |
100 |
Maximum length of the line profile between two cell centers are re-sampled to. Used to be able to compare the profiles. |
divisionMarkerLineProfilePeakLowerBound |
px |
10 |
Lower bound where a peak on line profile between two cell centers is still accepted. Used as threshold. |
divisionMarkerLineProfilePeakUpperBound |
px |
90 |
Upper bound where a peak on line profile between two cell centers is still accepted. Used as threshold. |
data3D |
bool |
0 |
Is data 2D (0) or 3D (1) |
pixelsPerZPlaneInterval |
1 |
The number of pixels that one Z-stack interval is equal to. |
|
active3DFingerprint |
bool |
0 |
Is 3D fingerprint used or closest z stack method |
cellThumbSideLength |
px |
100 |
Thumbnail side length around the center of a segmented object. Used i.e to cut out all cells contained in a single track from all image frames for visualization. |
maskOverlayAlpha |
0.4 |
Transparency (alpha) level for segmentation mask overlay on raw images for visualization. |
|
debugLevel |
1 |
Parameter defining the debug level. Level 0 shows no output. Level 1 shows general information (info mode). Level 2 shows additional debug info (debug mode). |